Purpose:
State chart diagram is one of the five UML diagrams used to model dynamic nature of a system. These define different states of an object during its lifetime. These states are changed by events. State chart diagrams are useful to model reactive systems. The Reactive systems can be defined as a system that responds to external or internal events.
State chart diagram describes the flow of control from one state to another state. The States are defined as a condition in which an object exists and it changes when some event is triggered. The most important purpose of State chart diagram is to model life time of an object from creation to termination.
State chart diagrams are also used for forward and reverse engineering of a system. The main purpose is to model reactive system.
Main usages of State chart diagrams are as follows:
- To model dynamic aspect of a system.
- To model the life time of reactive system.
- To describe the different states of object during its life time.
- Define state machine to model the states of an object.
How to draw State chart Diagram?
State chart diagram is used to describe the states of different objects in its life cycle. The emphasis is given on state changes upon some internal or external events. Such states of objects are important to analyze and implement them accurately.
State chart diagrams are very important for describing the states. The states can be identified as the condition of objects when a particular event occurs.
Before drawing the State chart diagram you must have clarified the following points:
- Identify the important objects which should be analyzed.
- Identify the states.
- Identify the events.
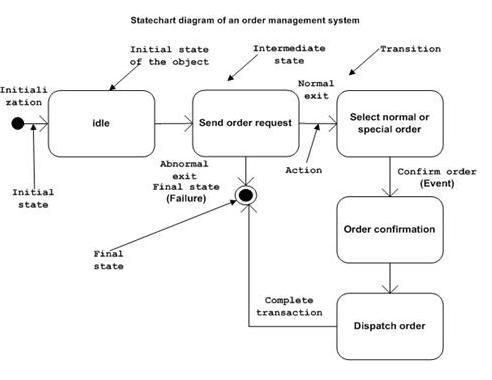
Following is example of State chart diagram where state of Order object is analyzed.
The first state is an idle state from where the process starts. Next states are arrived for events like send request, to confirm request, dispatch order. Such events are responsible for state changes of order object.
During the life cycle of an object (here order object) it goes through the following states and there may be some abnormal exists also. Abnormal exit may occur due to some problem in the system. The entire life cycle is complete then it is considered as the complete transaction as mentioned below.
Initial and the final state of an object is also shown below.
Where to use Statechart Diagrams?
From the above discussion we can define the practical applications of a Statechart diagram. The Statechart diagrams are used to model dynamic aspect of a system like other four diagrams disused in this tutorial. It has some distinguishing characteristics for modeling dynamic nature.
Statechart diagram defines the states of a component and these state changes are dynamic in nature. Its specific purpose is to define state changes triggered by events. The events are internal or external factors influencing the system.
Statechart diagrams are used to model states and also events operating on the system. To implement a system it is very important to clarify different states of an object during its life time and statechart diagrams are used for this purpose. These states and events are identified then they are used to model it and these models are used during implementation of the system.
If we look into the practical implementation of Statechart diagram then it is mainly used to analyze the object states influenced by events. Such analysis is helpful to understand the system behaviour during its execution.
So the main usages can be described as:
- To model object states of a system.
- To model reactive system. Reactive system consists of reactive objects.
- To identify the events responsible for the state changes.
- Forward and the reverse engineering.
With quick turnaround time, the site is providing solution to many complex issues with UML State chart Diagram. No matter what your degree or course is, just send the query along with the guidelines and you will get the response in very short time. By submitting after that just makes the payment and within promised time and you will get the solution in your mailbox. An added benefit is that assignments provided by the organizations are easy to understand and can be used for preparation of final exams and charges are very nominal.
Assignmentpedia presents:
- 24x7 Availability
- Trained and Certified Experts
- Deadline Guaranteed
- Plagiarism Free
- Privacy Guaranteed
- Online help for all Projects
- Reference style, Harvard, APA, AMA, MLA, IEEE